How I Use Fibonacci Retracement to Find Gold Entries Without Buying Every Retracement
If you've traded Gold for any length of time, you've probably experienced what I am about to describe below.
Price starts trending higher. You draw a Fibonacci retracement from the latest swing low to the swing high. Price pulls back to the 61.8% level, so you buy...
...only to watch Gold continue falling straight through your entry before eventually reversing much lower.
After repeating this mistake enough times, I realized that:
Fibonacci levels are not buy or sell signals. They're simply areas where I begin paying closer attention.
This small mind shift completely changed the way I look at retracements.
In this article, I'll show you exactly how I use Fibonacci to trade Gold (XAU/USD) without feeling the need to buy every pullback.
Why Most Fibonacci Trades Fail
The biggest misconception about Fibonacci is that the market is somehow obligated to reverse at 38.2%, 50%, or 61.8%.
But it is not.
Those levels simply highlight areas where buyers or sellers might become interested again.
Sometimes price reacts immediately, givin you short term scalping opportunity.
Sometimes it slices straight through every Fib level before reversing later.
Sometimes it never reverses at all.
That's why blindly placing pending orders at Fibonacci levels is one of the fastest ways to rack up unnecessary losses.
Instead, I treat Fibonacci as context, not confirmation.
Step 1: Start With a Meaningful Swing
Everything begins with identifying the correct swing.
If the swing is random, every Fibonacci level you draw afterward becomes meaningless.
For Gold, I only draw Fibonacci between significant market structure points—not every tiny movement that appears on the chart.
A meaningful swing is one that clearly shifted market structure and was followed by a strong directional move.
This keeps the Fibonacci levels relevant instead of cluttering the chart with dozens of conflicting retracements.
Step 2: Treat the Fibonacci Zone as an Area of Interest
Most traders become obsessed with exact numbers.
Price reaches exactly 61.8%.
They buy.
Professional traders usually think differently.
The entire region between the major retracement levels often matters more than any single line.
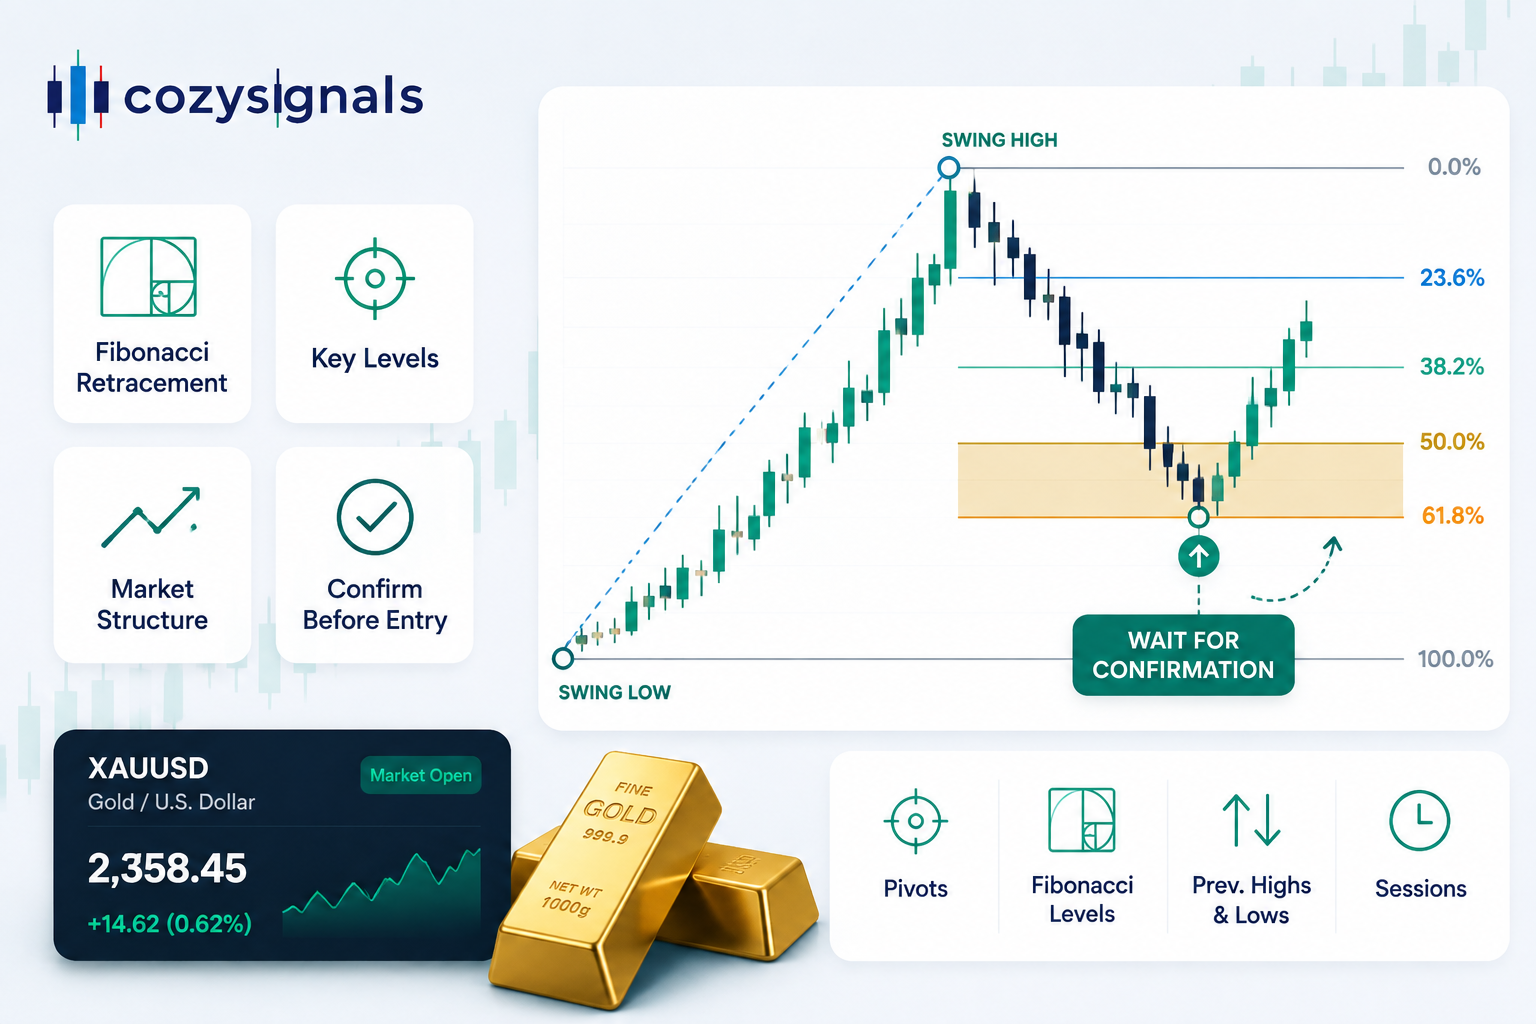
For me, the 50% and 61.8% levels usually form a reaction zone worth watching.
Sometimes Gold reverses before reaching 61.8%.
Other times it briefly trades beyond it before rejecting.
The exact number isn't the point, but the reaction is.
Step 3: Wait for Price to Arrive
This sounds obvious, but many traders start planning trades long before price reaches the retracement zone.
I simply wait.
I don't predict ahead.
I don't anticipate.
If price never reaches my Fibonacci area, I move on.
Missing a trade is far less expensive than forcing one.
Step 4: Look for Confirmation
This is where most of my decisions are made.
A Fibonacci level by itself doesn't convince me.
I want evidence that buyers are actually stepping in.
Some examples include:
-
A strong rejection candle
-
A liquidity sweep below recent lows
-
A bullish market structure shift
-
A higher low after the retracement
-
Strong buying momentum returning
The more reasons I have for entering, the better.
The Fibonacci level simply tells me where to look.
Price action tells me whether to trade at that point or not
Step 5: Know Exactly When You're Wrong
Every trade needs an invalidation point.
If price continues moving through my retracement area without showing any signs of rejection, I'm comfortable staying out.
If I'm already in the trade and price invalidates the setup, I exit.
Good trading isn't about proving you're right.
It's about accepting when the market disagrees.
Step 6: Define the Target Before Entering
One mistake I made early on was entering first and deciding where to exit later.
Now I do the opposite.
Before taking any Fibonacci trade, I already know where the market is likely to travel if the setup works.
Common targets include:
-
The previous swing high
-
The next resistance area
-
Fibonacci extension levels
-
A predefined risk-to-reward objective
Knowing the target beforehand makes it much easier to manage the trade objectively.
A Practical Gold Example
Imagine Gold is in a clear uptrend.
A strong impulsive move creates a new swing high.
Instead of chasing the breakout, I draw a Fibonacci retracement from the recent swing low to the new swing high.
Price begins pulling back.
Eventually it reaches the area between the 50% and 61.8% retracement.
At this point, I still do nothing.
Then something changes.
Price briefly sweeps below a recent low before quickly reclaiming the level, followed by a strong bullish candle that closes back above the Fibonacci zone.
That's the moment I become interested.
The trade isn't based on Fibonacci alone.
It's based on Fibonacci plus confirmation.
How CozySignals Makes This Easier
One challenge with Fibonacci is identifying meaningful swings consistently.
Different traders often draw completely different Fibonacci levels on the same chart.
That's one of the reasons we built Fibonacci analysis into CozySignals.
Instead of manually searching for new swings throughout the day, CozySignals automatically detects meaningful Gold swings and updates the latest Fibonacci retracement levels for you.
You can then focus on what actually matters, waiting for confirmation instead of constantly redrawing your chart.
If you'd like to receive these Fibonacci updates automatically, you can join our free Telegram channel where new Gold swing levels are shared as they develop.
Final Thoughts
Fibonacci hasn't become more profitable because I found a secret level.
It became more useful when I stopped treating it as a prediction tool.
These days, Fibonacci simply answers one question:
"If price reaches this area, should I pay attention?"
Everything that happens after that—market structure, rejection, momentum, liquidity—is what determines whether a trade is worth taking.
That single mindset shift helped me stop buying every retracement and started waiting for the ones that actually made sense.
And in trading, patience is often a bigger edge than finding another indicator. See you on the next one.